
Data analytics done right: Building your skills from the ground up
What other courses get wrong and how my lessons will set you up for success

👋🏽 Hey, it’s Ismail. Welcome to data nomads lab newsletter on learning data analytics, career growth, networking, building portfolios, and interview skills to break into tech role as a high-performer.
I have analyzed over 10 high-priced data analytics courses offered online, and here is what I discovered:
Most of them skip the foundational step of teaching statistics.
Instead, they jump straight into tools like SQL, Tableau, or Power BI.
But without a solid grounding in statistics, you are left building a house without a foundation.
If you have ever taken an online data analytics course or bootcamp, you might have noticed this gap. Statistics is the language of data, it’s where numbers come alive, whisper their secrets, and paint vivid pictures of hidden truths. Once you get it, you will start seeing patterns everywhere, even in your grocery list!
That is why I am doing things differently.
For over 10 years, I have worked in the field of data analytics, and for the past six years, I have had the privilege of teaching business and data analytics at one of Silicon Valley’s top online platforms, Udacity.com.
During this time, I have interacted with over 700 students, helping them break into tech careers.
One highlight of my journey has been contributing to the Udacity/OneTen scholarship program, which is dedicated to increasing Black representation in the tech industry.
These experiences have taught me what works and what does not when it comes to mastering data analytics.
Starting next week, I will be posting weekly lessons to help you build a strong foundation in data analytics. These lessons will not feel like a boring classroom lecture. They are simple, clear, and practical, dsigned to help you learn skills you can use right away.
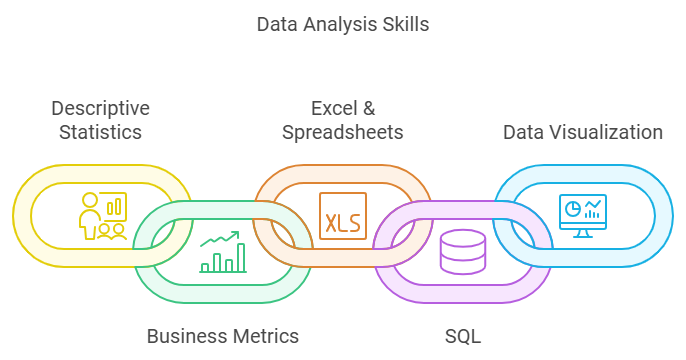
Here’s what you can expect:
Descriptive Statistics (Lesson 1): Learn how to summarize and understand your data with concepts like averages, medians, and ranges. This is where every great data analyst starts.
Business Metrics (Lesson 2): Understand the numbers that businesses care about most, like revenue, profit, and growth rates.
Excel (Spreadsheets) (Lesson 3): Master the basics of organizing and analyzing data with Excel, a must have skill for any analyst.
SQL (Lesson 4): Dive into databases and learn how to pull the right data for your analysis.
Data Visualization (Lesson 5): Bring your data to life with tools like Tableau or Power BI.
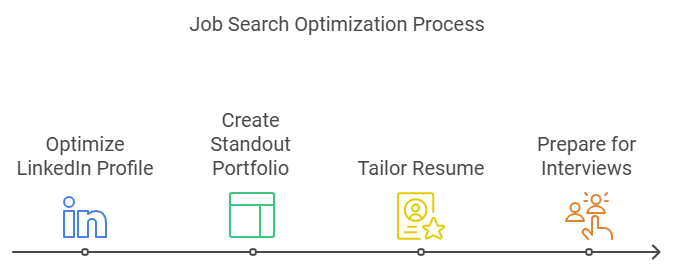
But I will not stop there. Once you have the technical skills, we will focus on the soft skills that help you land a job and grow your career, like:
How to optimize your LinkedIn profile and build your network.
How to create a portfolio that stands out.
How to tailor your resume to specific job postings.
How to prepare for interviews like a pro.
Every week, I will share a new lesson with clear examples and actionable steps. My goal is to make these lessons simple enough for anyone to follow, whether you’re just starting or looking to sharpen your skills.
If you have ever felt overwhelmed by all the tools and jargon in data analytics, this is the newsletter for you. Let’s take it one step at a time and build your confidence together.
See you in Lesson 1: Descriptive Statistics!
Stay curious