
Coffee shop statistics: real-world data made simple
Learn data analytics through everyday business examples - no degree required

👋🏽 Hey, it’s Ismail. Welcome to data nomads lab newsletter on learning data analytics, career growth, networking, building portfolios, and interview skills to break into tech role as a high-performer.
I am sitting at my favorite locally owned coffee shop, sipping a perfectly foamy cappuccino with honey and cinnamon on top, just how I like it. The place is full of life today. A family plays Monopoly in the corner. Students study with their textbooks spread out. An older couple works on a crossword puzzle by the window. Kids are setting up board games at the big table.
Looking at all these people going about their day, I start thinking about patterns. Numbers are like that, too - they tell simple stories about everyday life. Let me show you what I mean.
The fear is real (but it does not have to be)
Common fear I hear: I will never understand all these numbers.
Common frustration: Why cannot someone explain this simply?
Common desire: I want to see how this works in real life.
Let me show you how I turned these worries into wins using only coffee shop numbers.
Sample coffee shop numbers
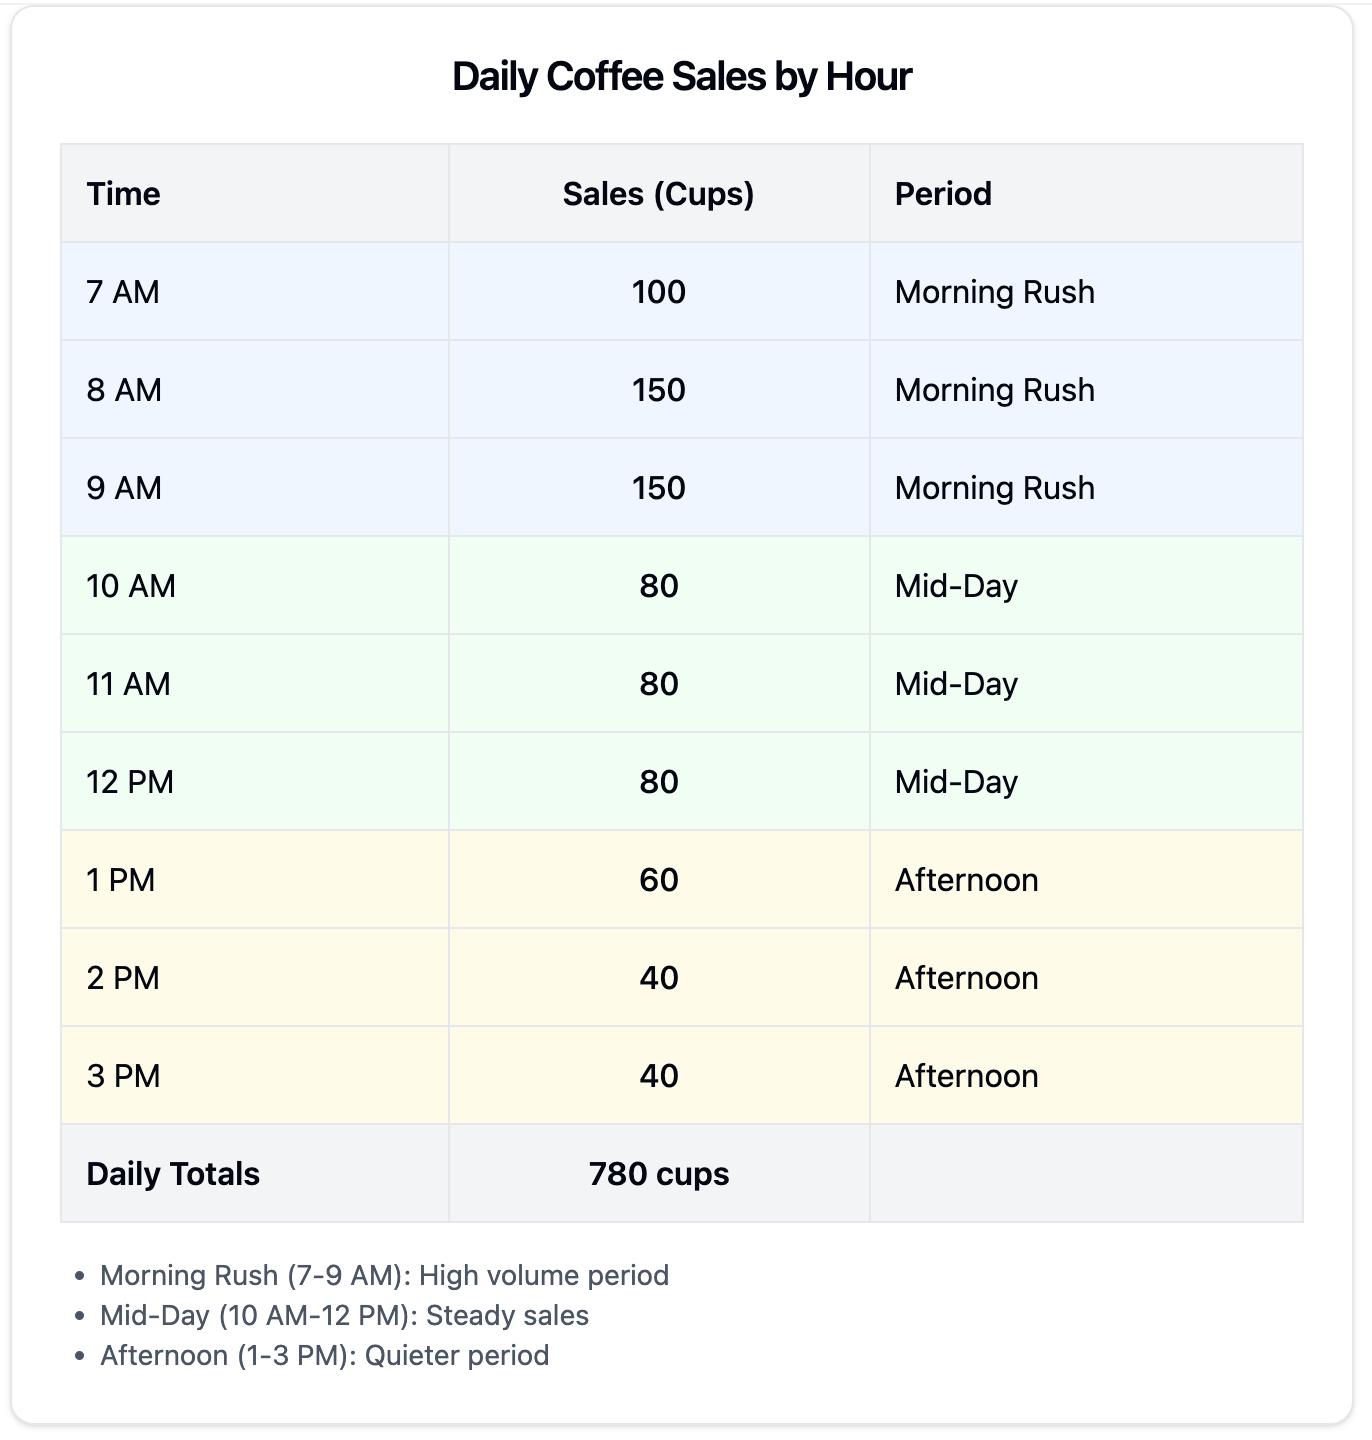
Here are our coffee sales per hour:
Frustration #1: There are too many numbers!
Solution: Break them into simple groups
Morning Rush (7-9 AM):
These are your busy hours
Sales: 100, 150, 150 cups
Mid-Day (10 AM-12 PM):
Your steady hours
Sales: 80, 80, 80 cups
Afternoon (1-3 PM):
Your quiet hours
Sales: 60, 40, 40 cups
See? Already less overwhelming.
Fear #2: What if I calculate something wrong? let us break this down - finding the center
Solution: Start with simple counts
Most Common Number (Mode):
Count how many times each number appears
150 appears 2 times
80 appears 3 times
40 appears 2 times
80 is your mode - that is your most typical hour
That is it! Just counting. No complex math.
Desire #3: I want to make better business decisions
Solution: Use the right number for the right decision
Let us say you need to order cups for next week:
Average (Mean):
Add all numbers: 100 + 150 + 150 + 80 + 80 + 80 + 60 + 40 + 40 = 780
Divide by how many hours (9)
780 ÷ 9 = 87 cups per hour average
But wait! Sometimes average is not your best friend.
Middle Number (Median):
Line up all numbers: 40, 40, 60, 80, 80, 80, 150, 150
Find the middle: 80
This ignores those super busy and super quiet times
Quick coffee tip: Imagine your coffee shop typically sells 80 cups each hour, but one day a huge business conference orders 500 cups for their event. Your average for that day would jump way up to 122 cups per hour ((8 × 80 + 500) ÷ 9 = 122). But is that really a “typical” hour? This is when median saves the day - it would still show 80 cups as your middle number, giving you a more realistic picture of your usual business.
Another example: What if a snowstorm hits and you only sell 5 cups during one hour? Your daily average would drop unusually low, but median would still show your typical 80 cups, helping you plan better for normal days.
Fear #4: But what about all the ups and downs?
Solution: Understand your spread
Range (Highest to lowest):
Highest number: 150
Lowest number: 40
Range = 150 - 40 = 110 cups This tells you how much your sales bounce around
Middle Range (IQR):
Take the middle 50% of your numbers
Highest middle: 150
Lowest middle: 60
Middle range = 150 - 60 = 90 cups - This tells you your normal bouncing around, ignoring extreme times
Real talk: why this matters
Remember that student fear: I will never get this? Here is what actually happens:
You learn to count what happens most (mode)
You learn to find the middle ground (median)
You learn to see patterns in your busy and quiet times
Turning fears into power moves
When to use Average:
Ordering supplies for the whole day
Planning overall revenue
Making long-term predictions
When to use Middle Number (Median):
Setting staff expectations
Planning typical scenarios
Ignoring those crazy busy or super slow times
When to use Most Common Number (Mode):
Scheduling regular staff
Preparing standard inventory
Understanding your usual business
The big win
One of my students said it best: “I used to panic when I saw numbers. Now I see stories. I see busy mornings, lazy afternoons, and all the coffee in between.”
That is what statistics really is - finding the stories in your numbers.
Your turn
Next time you are at a coffee shop:
Count how many people are in line at different times
Notice the busy and quiet patterns
Think about what “typical” means for that shop
Congratulations! You are already doing statistics.
Stay curious (and caffeinated)!
Ismail Osman
Share your own coffee shop number stories below. What patterns have you noticed at your local cafe?